
Lviv Interactive
June 5-9, 2017
Ravenna, Italy
The Lviv Interactive project of the Center for Urban History was selected to participate in the International Public History Conference
The presentation of the project was scheduled for the poster session.
Learn more about the idea and the poster itself presented by the project coordinator Taras Nazaruk to conference participants.
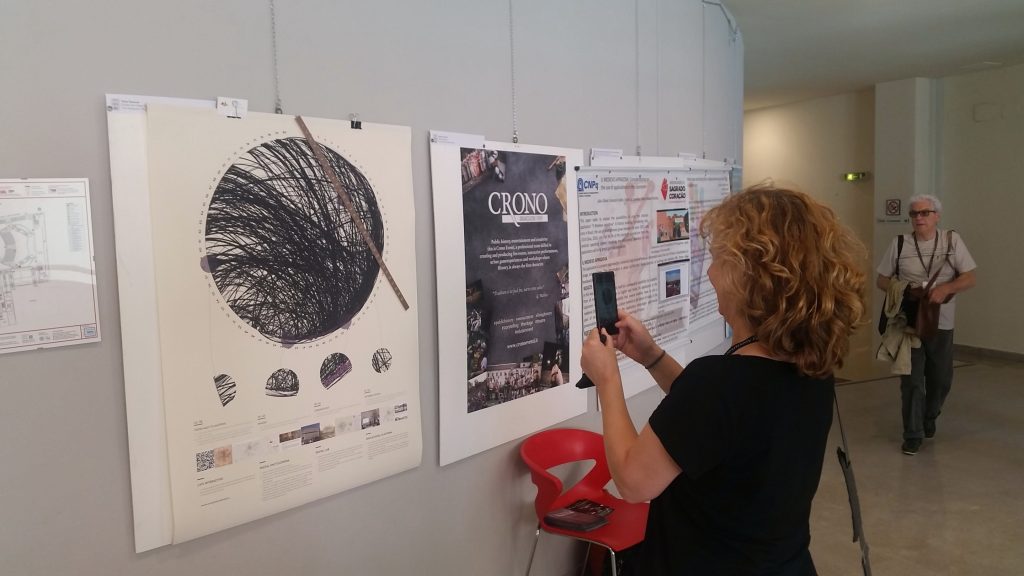
What Is on the Poster
Lviv Interactive is an online project showing the city and its history through places and spaces. Over the 10 years of its implementation, the project has prepared materials on over a thousand of objects. At the same time, we keep experimenting with digital tools to create a well-worked platform in the field of digital humanities and public history.
In order to emphasize on the digital nature of the project and the peculiarities entailed, and also to do it in an analogous way, i.e. on a paper poster, we decided not to use a familiar city map but something behind it, or the database. By explicating the nature of the database, we wished to clarify the essence of Lviv Interactive.
We asked our colleagues from the SiteGist company, a technical support provider for digital projects of the Center for Urban History, to generate a document on the status of the database of our project. On the basis of the document, and with the help of Gephi, a software to analyze networks and big data developed in the Technical University of Compiègne (France), we created data visualization for Lviv Interactive.

Interface is an important element in digital projects, and is used for navigation, among other things. Its quality defines the accessibility of materials for users, and how public the history processed within the project is going to become.
For navigating through the database on our poster, and also for interaction typical of digital projects, and implied by the name of the project, we needed a tool. It was supposed to be different than a digital interface. For that matter, it was decided to use the city map of Lviv disseminated as a supplement in 1936 by a local newspaper. The map also included a list of streets, and a ruler on top of it. You could find a wanted street at the intersection of two numbers – from the ruler and from the scale available at the perimeter of the map.
We used the format of a scale and a ruler to visualize the data, and highlighted the positions of the three fragments. Each fragment shows certain aspects of what the Lviv Interactive project is about.
What the Data Visualization Implies
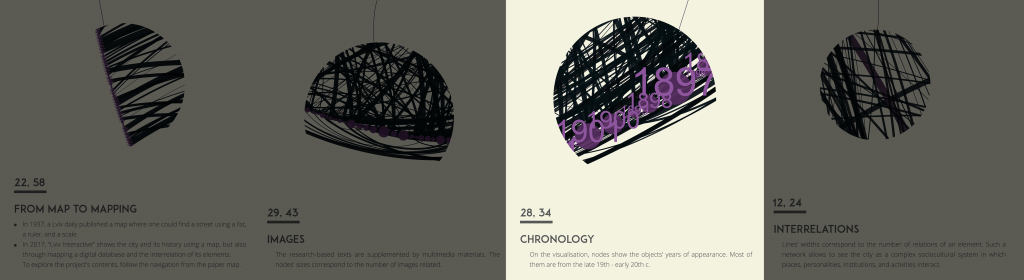
The Chronology fragment shows the period our project mostly refers to. The visualization shows that most materials are about the history of architecture, urban planning and urban heritage of the late 19th century until the early 20th century. At the same time, the project does not have any strict timeframe. Instead, it focuses on numerous research interests of the researchers we work with. Therefore, the map shows both objects going back to early modernist period, and samples of late Soviet socialist buildings. In addition, the materials on the website are grouped by topics, such as Jewish City, Sykhiv: Macro History of the Micro Region, or are posted as pages of a study, such as Pidzamche: Places and Spaces.
The Images fragment tells about the multimedia nature of the project and engagement of different sources to construct additional outlooks on the objects from encyclopaedia. An object size implies the number of related images. While illustrating the place and explaining the space it is located in, we are taking a present-day position, in the first place. We engage photographers to record a current status of the object. In addition, for some objects marked on the city map we included historical photos from the Urban Media Archive, another digital project in the Center for Urban History. It allows tracing changes of the place, among other things. In partnership with the State Archive of Lviv Region, we can additionally digitalize and publish building drawings for some objects. It helps studying their architectural planning details.
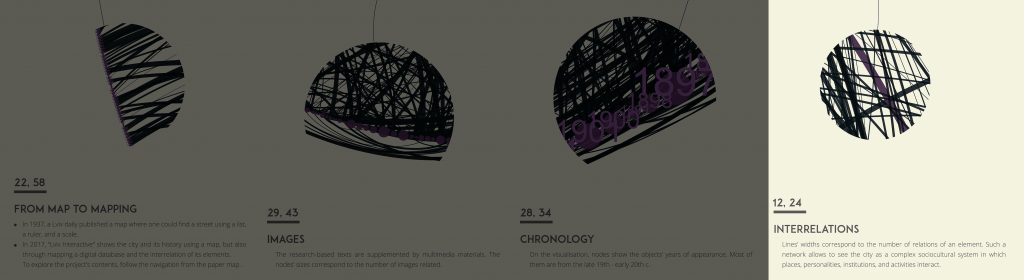
The Interrelations fragment shows another important element of digital projects. The width of each line explains the number of links of an object with others. The database of Lviv Interactive not only provides for having a set of objects organized by certain categories (such as chronology, building type, location, etc.), but also for constructing links of this object to other objects in the city. This way, a look on a separate building can be a look on a part of a wider network of links to other places, institutions, and personalities, or a more complex sociocultural system a city makes.

The project is a digital laboratory for experimenting with the analysis tools and visualization of historical data. To construct multimedia stories on the basis of our achievements, we are trying to develop storytelling tools, such as the history of Bohomoltsia street, a Secession ensemble of a valuable monument of urban planning in Lviv. The focus of studying the networks is made possible along with the creation of the respective tool. Within the project Imaginary Map of Literary Lviv +-1939, on the basis of memories, it was constructed and visualized a network that allows tracing the nature of changes in a literary life of the city parallel to the consolidation of the Soviet rule.
Besides, Lviv Interactive is trying to be an online platform for education initiatives, both in the Center for Urban History (within the program Far Near History. On the 1990s in Another Way), and in partnership with other academic institutions (Crossroads of Empire, materials for an interdisciplinary workshop in Stetson University (USA).
Poster design by Andriy Linik, Olha Zarechnyuk, Taras Nazaruk.
Photo credits to Olha Zarechnyuk, Taras Nazaruk.